Lean Profiling
Lean has good support for profiling tactic scripts, with incrementally more information. There are two different profilers in Lean, a general profiler called profiler and a newer profiler with more detailed information called trace.profiler.
trace.profiler
First we will cover the more advanced trace.profiler, which can give an incremental trace of the time taken for each tactic in the tactic script. For example, enabling the profiler using set_option trace.profiler true in will produce the profiling trace shown below.
import Lean

set_option trace.profiler true in
example : True := by
  sleep 2000
  constructor
[Elab.command] [2.001815] example : True := by
      sleep 2000
      constructor
  [Elab.step] [2.000551]
        sleep 2000
        constructor
    [Elab.step] [2.000525]
          sleep 2000
          constructor
      [Elab.step] [2.000132] sleep 2000
For small examples, the profiler might not actually display anything. This is because there is a threshold of at least 100ms before the result is shown. This can be adjusted by using:
set_option trace.profiler.threshold 10
Firefox profiling view
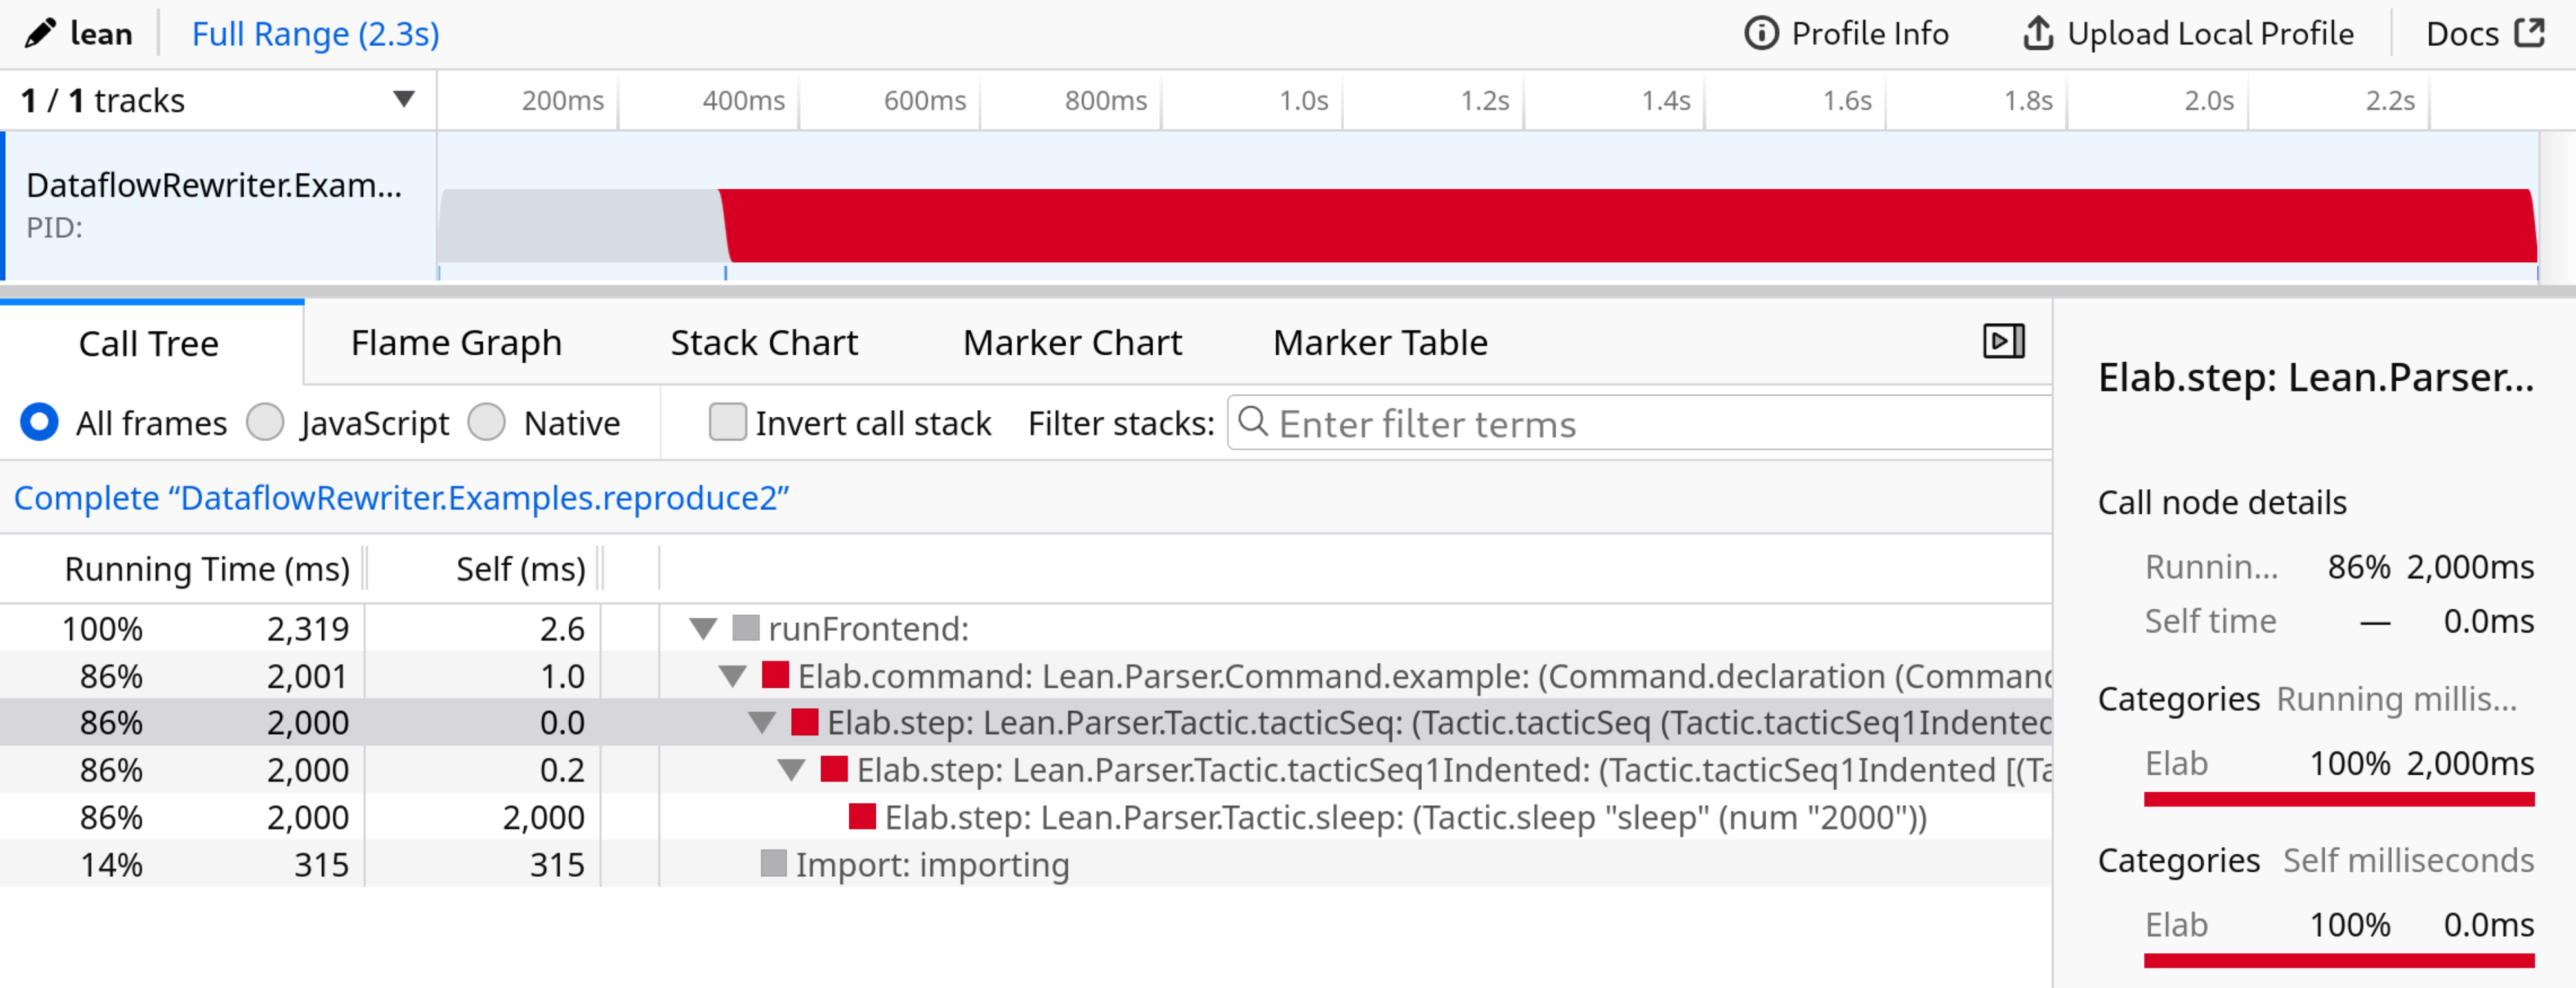
In addition to the textual view, the profiler also supports a firefox profiler view, which is an advanced dashboard that can be used to interactively look at the profiling trace.
The two options that are needed to enable this profiler are:
set_option trace.profiler.output "/tmp/profile.json"
set_option trace.profiler.output.pp true
The first option enables profiling to a file instead of the “Info view” of the editor. The second option enables a more detailed description of each operation that is being performed, showing for example the terms that are actually being reduced at each stage.
However, these options do not work when they are set inside of a lean file, instead they need to be set before the lean interpreter is even started. To do that, they have to be set on the commandline as the lean file is being interpreted.
lake env lean -Dtrace.profiler.output=profile.json -Dtrace.profiler.output.pp=true main.lean
Adding lake env before the command will ensure that the lean file can import other files in the project. This produces a trace that can be view in the firefox profiler view.

The profile can even be uploaded and shared.
profiler
There is also a lighter weight profiler in lean that can be useful to quickly check the time taken to prove a theorem or reduce a term. It will also show information about how much time the lean interpreter spent in each of its phases like elaboration, type-class inference and type checking. This can be enabled locally on tactics or commands using:
set_option profiler.threshold 10 in
set_option profiler true in
where the threshold can also be used to show more profiling info for pieces of the execution that were above the threshold.